Saturday, December 29, 2012

Taxes in NL Are Deeply Regressive

I've added a small followup to this post here.

In a recent interview with NTV, while addressing the provincial budget deficit, Premier Dunderdale stated that

"16% of people in the province pay 70% of the taxes. We need to talk about that."

The premier seems to feel that most Newfoundlanders (i.e. the non-rich ones) do not pay their fair share of taxes. Perhaps she is setting the stage for a regressive tax hike or perhaps she feels that introducing the idea will make cutbacks more palatable and help her with labour negotiations.  In any case, her numbers are bogus and she needs to be called out on it.

I don't know where Dunderdale got her numbers (if anyone knows, please comment), but she is pretty clearly talking about income taxes only, not taxes in general.  According to the latest CRA data, the top 17% of income tax filers paid 67% of provincial income taxes in 2009.  Conflating "income taxes" with "taxes" (a common trick in right-wing American politics: lucky duckies, we are the 53 percent, the Romney video, etc.) is particularly egregious in the NL context where personal income taxes make up only about 13% of government revenue.

Most people pay more in sales tax than income tax, and many spend more on gas and tobacco taxes than income tax, so focussing exclusively on income tax is deeply misleading. Furthermore, top income tax rates were cut in 2010 meaning that even the share of income taxes paid by the rich is less than Dunderdale's figure (probably closer to 60% than 70%).

In the following chart, I've plotted my estimate of the share of income going provincial taxes as a function of total income of individuals. I've had to make a few assumptions that are explained at the end of this post.

People with total income of $10,000 or more pay 10-to-15 percent of their income on these four taxes. The rate grows with income, but only moderately. The top 17% of income tax filers receive 46% of total income and pay about 50% of provincial taxes.   

But this is not the end of the story.  These taxes only account for about 30% of government revenue.  What about the rest?

The government receives about 17% in federal transfers and 7% from corporations.  I'm going to ignore these because I'm interested in taxes on people in Newfoundland.

The biggest revenue source is offshore royalties which account for about 35% of revenue. How one understands ownership of oil revenues is crucial to deciding who is carrying the tax burden in this province.  My position is that the natural resources of our province belong to the people of our province and that they belong to each of us equally.  A poor Newfoundlander has as much claim to our resources as a rich Newfoundlander.   If you'll grant that much, then it stands to reason that the offshore royalties belong to each of us equally, the poor as much as the rich.  Thus we should treat royalties as personal income that is equally distributed and taxed at 100%.

I treat in the same way the much smaller revenues from mining royalties, NLC revenues, lotteries, driver licenses and so on.  This works out to a per capita income of about $5800 a year, of which $5000 comes from oil.  Treating this as personal income that is taxed at 100% results in the following chart.
From this perspective, provincial tax rates are deeply regressive.  The poorest people are paying close to 40% of their income in taxes, the middle class is paying 20-30%, and the rich are paying about 15%.  To use Dunderdale's standard, the richest 17% are only paying about 31% of the total tax burden.

Someone needs to ask Kathy Dunderdale "who owns the natural resources of this province?". If she replies by saying that they belong to the people, then she has no business arguing that the rich are paying more than their share.

******* Note on Calculations *******

Friday, December 28, 2012

The Anti-Avalon Bias of Provincial Election Boundaries

According to the Electoral Boundaries Act, section 15(1):  

"the commission shall ensure that the division of the province into districts and the description of the boundaries give primacy to the principle that the vote of every elector in the province shall have a weight equal to that of every other elector."

Let's consider how well this principle is being met by current boundaries. Since the 2006 redistribution there are 4 districts in Labrador, 19.5 on the Avalon, and 24.5 on the island outside of the Avalon (I've split Bellevue in half). The average populations of these districts from the 2011 census are as follows.


Region
Average Population
Labrador districts:
6700
Off-Avalon districts:
9200
Avalon districts:
13450

Avalon districts contain 50% more people than off-Avalon districts and twice as many as Labrador districts. Considered differently, the Avalon would have 5 more seats if the districts were evenly divided.

How did this happen? There are at least three contributing factors: the act requires four districts in Labrador, the boundaries were drawn using 2001 census numbers which don't account for net migration to the Avalon since then, and even based on the outdated 2001 figures the districts in the North-East Avalon were drawn about 15 percent larger than those outside of the Avalon. 

The next redistribution of districts is scheduled for 2016, so unless the act is changed our next election will take place with these lopsided districts that are only getting worse. A change before the election would likely help the NDP, so it probably isn't going to happen.

Instead I'll make a more modest proposal.  Why not postpone the redistribution until 2017 so the commission can use the 2016 census instead of the 2011 census?  It's crazy to draw the boundaries just a few months before the new census data goes public.  The commission might also be permitted to consider population growth projections when setting the boundaries so they don't become outdated as quickly.

*********** Update ************

This chart shows the share of the province's population living in the St. John's census metropolitan area (CMA) versus the share of electoral districts.


Friday, December 21, 2012

Fertility Rates in Newfoundland and Labrador

Update:  The Sir Robert Bond Papers has written a response to this post here.

In 2007, the PC party of NL introduced a $1000 bonus for women who give birth or adopt a baby.  The Sir Robert Bond Papers blog has recently run a series of posts analyzing the effect of this policy on birth rates, concluding that the effect has been small and temporary.   There are a few problems with his analysis though, so I'd like to add to this discussion.

Firstly, his analysis considers only the number of births per year, which fails to account for changes in population and demographics.  A better indicator is the fertility rate: the average number of live births a woman can expect in her lifetime based on age-specific fertility rates in a given year.  Secondly, his analysis doesn't acknowledge that declining birth rates is a trend nation-wide and that provincial rates should be compared to what is happening in other provinces.

The following chart compares NL fertility rates to Canadian fertility rates.  The rates are per 1000 women so a rate of 2000 means that the average woman will have 2 births in her lifetime based on that years stats.
This shows that fertility in NL is consistently below national averages, but has jumped much closer in recent years.  The timing of that jump is easier to see by charting the difference in fertility rates by year.
The jump happened in 2008, the year after the new policy was enacted.  Moreover, the difference has actually narrowed since then.  Now I'm sure that the booming economy has a lot to do with this, but the data is entirely consistent with the PC baby bonus having a significant and enduring effect.

Tuesday, December 18, 2012

Council Meeting Fireworks


The following summary of tonight's St. John's Council meeting was written by Sherwin Flight.  

Here's a basic rundown of what happened today at City Hall.

- At the very beginning, Mayor O'Keefe had everyone in the room stand for a minute of silence for the victims of the recent school shooting in the U.S. He talked about how safety is such an important thing, something we all need to focus on, and how the world just wasn't what it used to be. (More on this later)

Monday, December 17, 2012

Marijuana Law Enforcement in Newfoundland and Canada

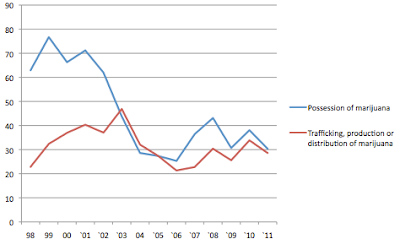
Data from Statistics Canada suggests that police in Newfoundland and Labrador are no longer charging people for simple possession of marijuana.   This contrasts with national data that show simple possession charges rising.

The following charts shows rates of marijuana charges per 100,000 population.  The blue line is charges for possession and the red line is charges for trafficking, production, or distribution.  Since most people charged with a more serious marijuana crime are probably also charged for possession, the gap between the lines gives a measure of charges for simple possession.

Rates of marijuana charges in Canada

Rates of marijuana charges in Newfoundland and Labrador


Since about 2003, charges for possession in NL have barely exceeded those for more serious violations, and fell slightly below in 2003 and 2004.   In contrast, the rates of possession charges in Canada have been growing steadily since 2005 while rates for more serious charges have held steady.  I suspect the fact that Stephen Harper became prime minister in 2006 has something to do with this.

Thursday, December 6, 2012

Tax the Rich — An Animated Fairy Tale

Tuesday, December 4, 2012

R.I.P NL Democracy

via People's Assembly NL

Please join us to mark the passing of democracy in Newfoundland and Labrador on December 5, 2012. Visitation hours are from 12-3 PM on the stairs of Confederation Building, where a book of condolences will be available for signing.

NL Democracy was born in 1832. It suffered a near death experience in 1933, was partially resuscitated in 1949, but is set to be executed December 5, 2012.

NL Democracy leaves behind to mourn the people of Newfoundland and Labrador, present and future. In lieu of flowers, please join us for a vigil and memorial service at Confederation Building.
Newer Posts Older Posts Home