
For fun, I decided to do my own projections using a very simple model under a few different scenarios. In the models below, I assume:
- Every person dies on their 80th birthday.*
- There is an equal number of males and females in each age group.
Here is the chart. The scenarios are explained below.
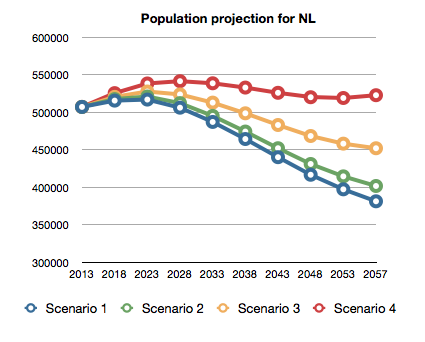
In the first scenario, I assume that fertility rate remains constant and equal to the average of the last five years. I also assume that net immigration is zero (both international and interprovincial). I get this table:
Scenario 1
|
2013
|
2018
|
2023
|
2028
|
2033
|
2038
|
2043
|
2048
|
2053
|
2057
|
|
|
Population under 80
|
507239
|
515643
|
517034
|
506214
|
487204
|
464429
|
440218
|
416780
|
397367
|
381402
|
|
0 to 4
|
24162
|
23961
|
23270
|
22314
|
20996
|
19815
|
18978
|
18345
|
17791
|
17117
|
|
5 to 9
|
25660
|
24162
|
23961
|
23270
|
22314
|
20996
|
19815
|
18978
|
18345
|
17791
|
|
10 to 14
|
26429
|
25660
|
24162
|
23961
|
23270
|
22314
|
20996
|
19815
|
18978
|
18345
|
|
15 to 19
|
28830
|
26429
|
25660
|
24162
|
23961
|
23270
|
22314
|
20996
|
19815
|
18978
|
|
20 to 24
|
31400
|
28830
|
26429
|
25660
|
24162
|
23961
|
23270
|
22314
|
20996
|
19815
|
|
25 to 29
|
30810
|
31400
|
28830
|
26429
|
25660
|
24162
|
23961
|
23270
|
22314
|
20996
|
|
30 to 34
|
31524
|
30810
|
31400
|
28830
|
26429
|
25660
|
24162
|
23961
|
23270
|
22314
|
|
35 to 39
|
33082
|
31524
|
30810
|
31400
|
28830
|
26429
|
25660
|
24162
|
23961
|
23270
|
|
40 to 44
|
37204
|
33082
|
31524
|
30810
|
31400
|
28830
|
26429
|
25660
|
24162
|
23961
|
|
45 to 49
|
41783
|
37204
|
33082
|
31524
|
30810
|
31400
|
28830
|
26429
|
25660
|
24162
|
|
50 to 54
|
43189
|
41783
|
37204
|
33082
|
31524
|
30810
|
31400
|
28830
|
26429
|
25660
|
|
55 to 59
|
42590
|
43189
|
41783
|
37204
|
33082
|
31524
|
30810
|
31400
|
28830
|
26429
|
|
60 to 64
|
40006
|
42590
|
43189
|
41783
|
37204
|
33082
|
31524
|
30810
|
31400
|
28830
|
|
65 to 69
|
33134
|
40006
|
42590
|
43189
|
41783
|
37204
|
33082
|
31524
|
30810
|
31400
|
|
70 to 74
|
21879
|
33134
|
40006
|
42590
|
43189
|
41783
|
37204
|
33082
|
31524
|
30810
|
|
75 to 79
|
15557
|
21879
|
33134
|
40006
|
42590
|
43189
|
41783
|
37204
|
33082
|
31524
|
|
80 to 84
|
10402
|
15557
|
21879
|
33134
|
40006
|
42590
|
43189
|
41783
|
37204
|
33082
|
The population grows until a peak in year 2023 and then falls rapidly. In 2035, the population is between 487,000 and 465,000 - in line with the Conference Board estimate.
In scenario 2, I assume that our fertility rate increases to the Canadian average and remains constant, and that net immigration is zero.
Scenario 2
Scenario 2
|
2013
|
2018
|
2023
|
2028
|
2033
|
2038
|
2043
|
2048
|
2053
|
2057
|
|
507239
|
517704
|
521104
|
512312
|
495278
|
474394
|
452180
|
431155
|
414646
|
401814
|
In scenario 3, I use current NL fertility rates, but assume immigration of 1000 twenty year olds per year (actually 5,000 every five years in lump sums).
Scenario 3
|
2013
|
2018
|
2023
|
2028
|
2033
|
2038
|
2043
|
2048
|
2053
|
2057
|
|
507239
|
520643
|
527764
|
523890
|
512979
|
498728
|
483131
|
468473
|
458251
|
452129
|
In scenario 4, I use current fertility rates but assume immigration of 2000 twenty year olds per year (actually 10,000 every five years in lump sums).
Scenario 4
|
|
2013
|
2018
|
2023
|
2028
|
2033
|
2038
|
2043
|
2048
|
2053
|
2057
|
|
507239
|
525643
|
538494
|
541566
|
538753
|
533027
|
526045
|
520168
|
519136
|
522857
|
In this scenario, population is basically flat.
No comments:
Post a Comment